Corax for Insurance
Corax offers different solutions based on where you fit in to the cyber insurance equation.
Corax for Brokers
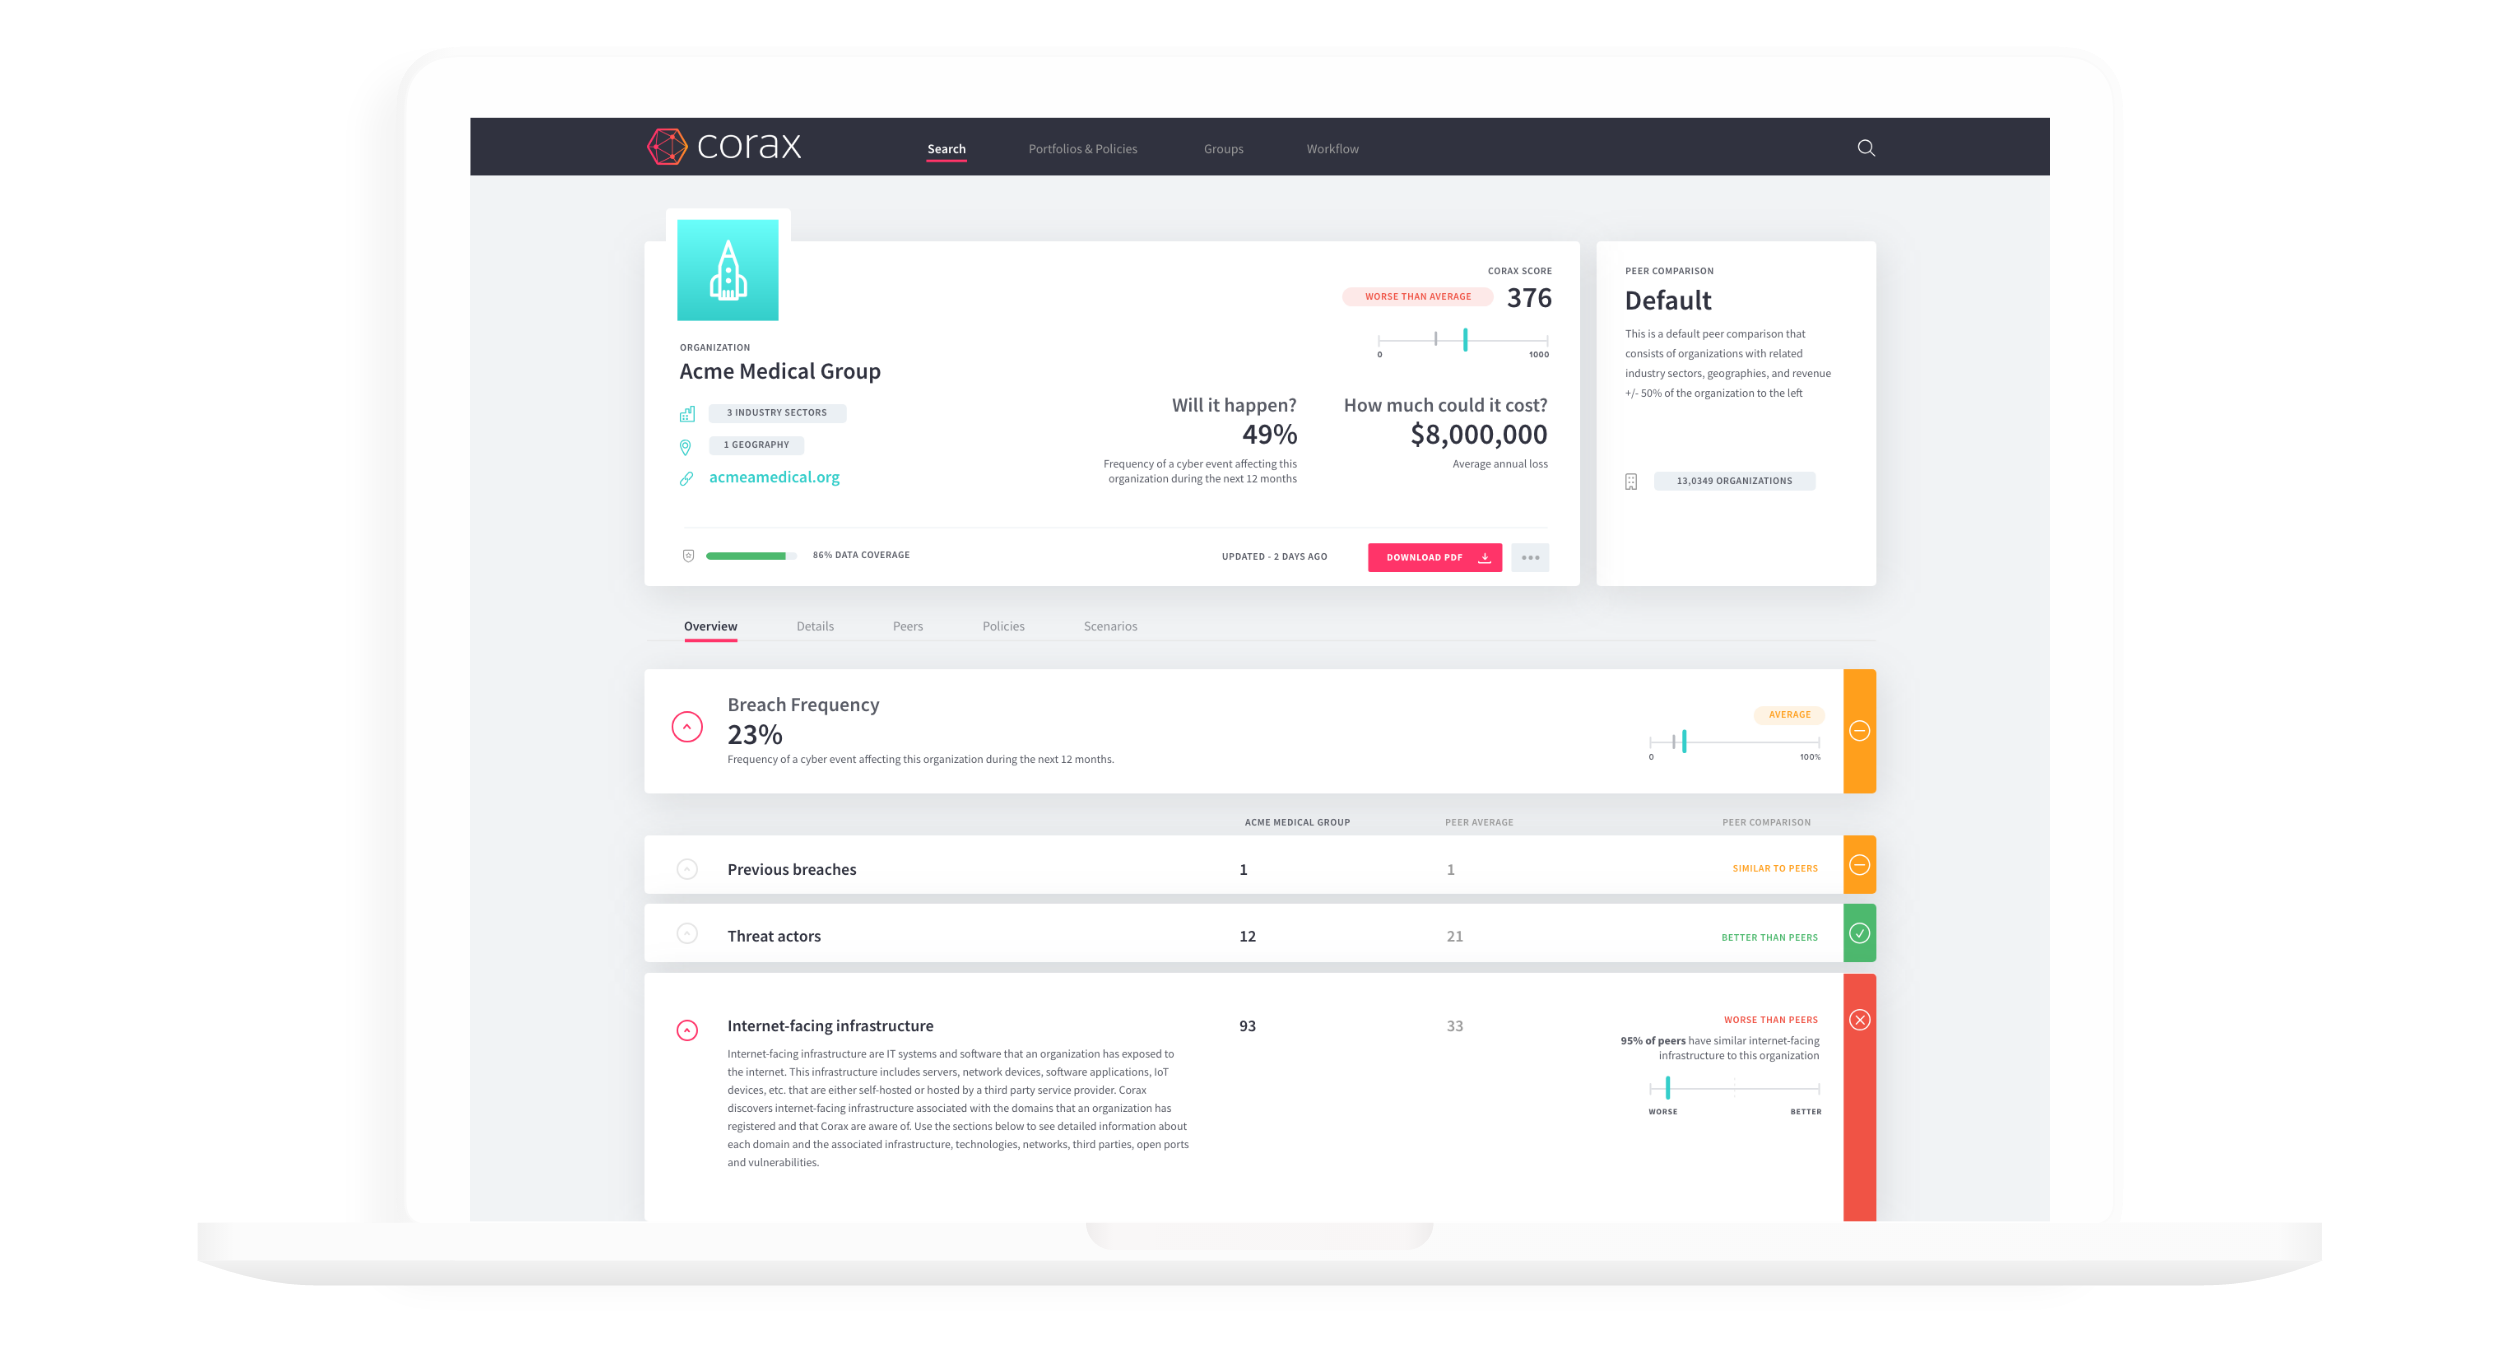
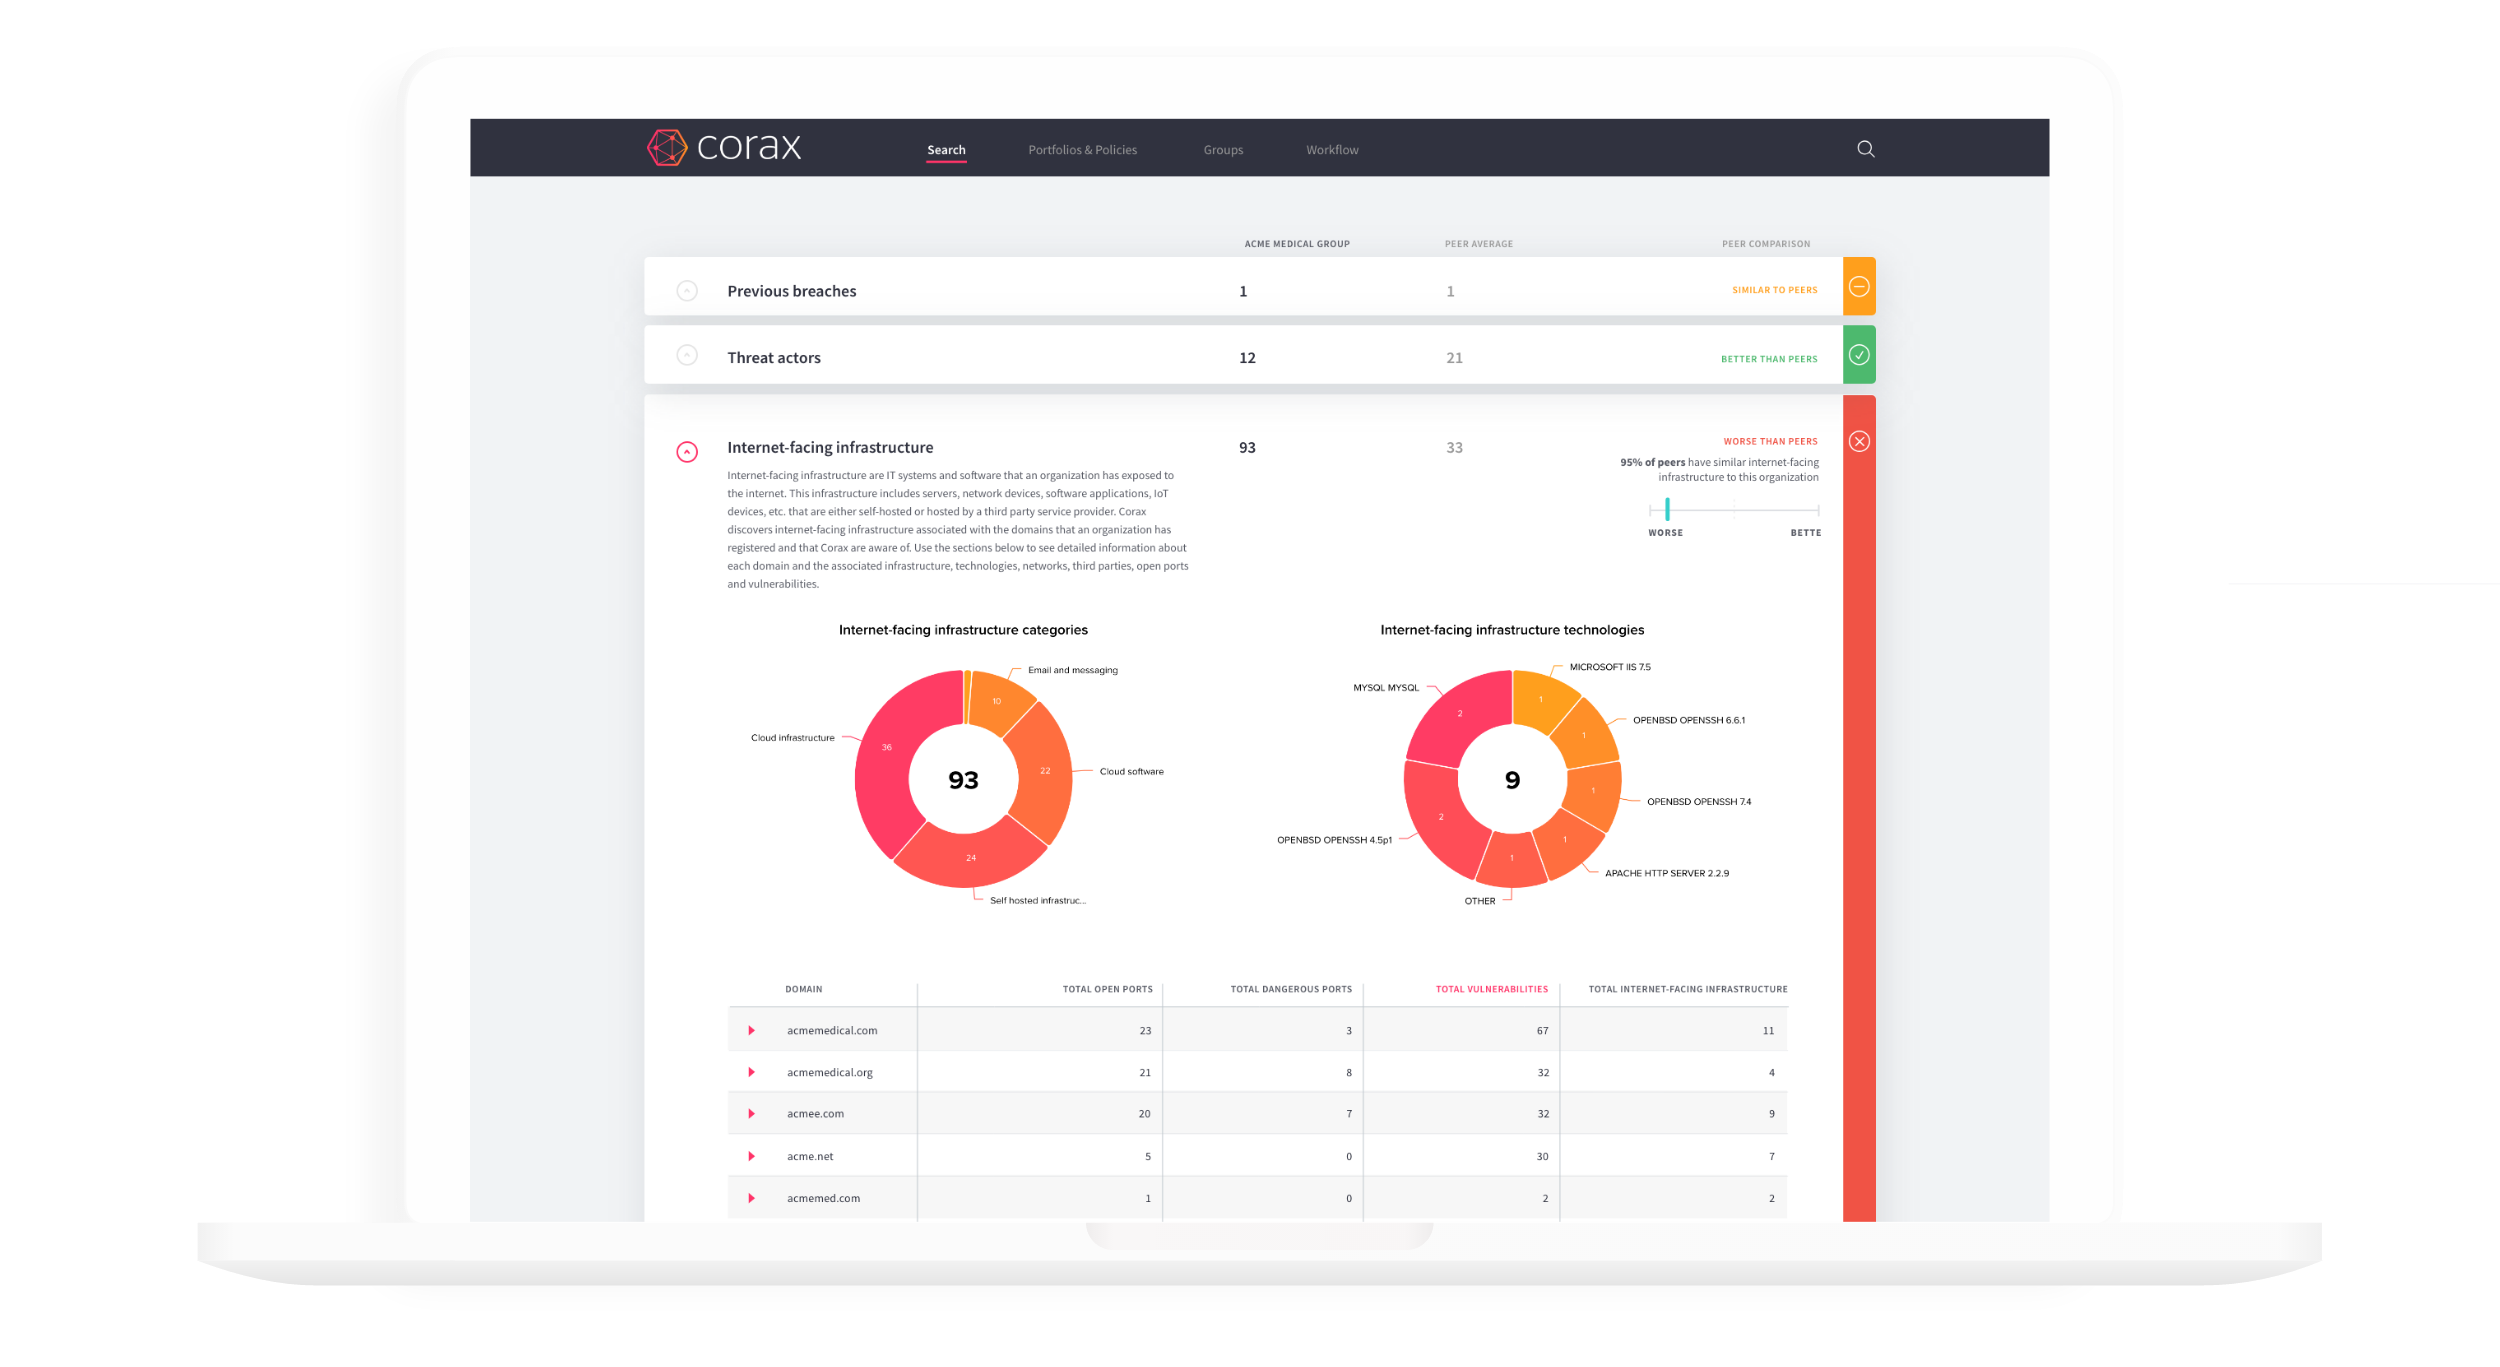
The Corax platform provides brokers with access to insight and reports on millions of companies. Brokers are using this to provide clients with precise cyber risk assessment, benchmarking, cover recommendations, risk mitigation recommendations, and to identify targeted sales leads.
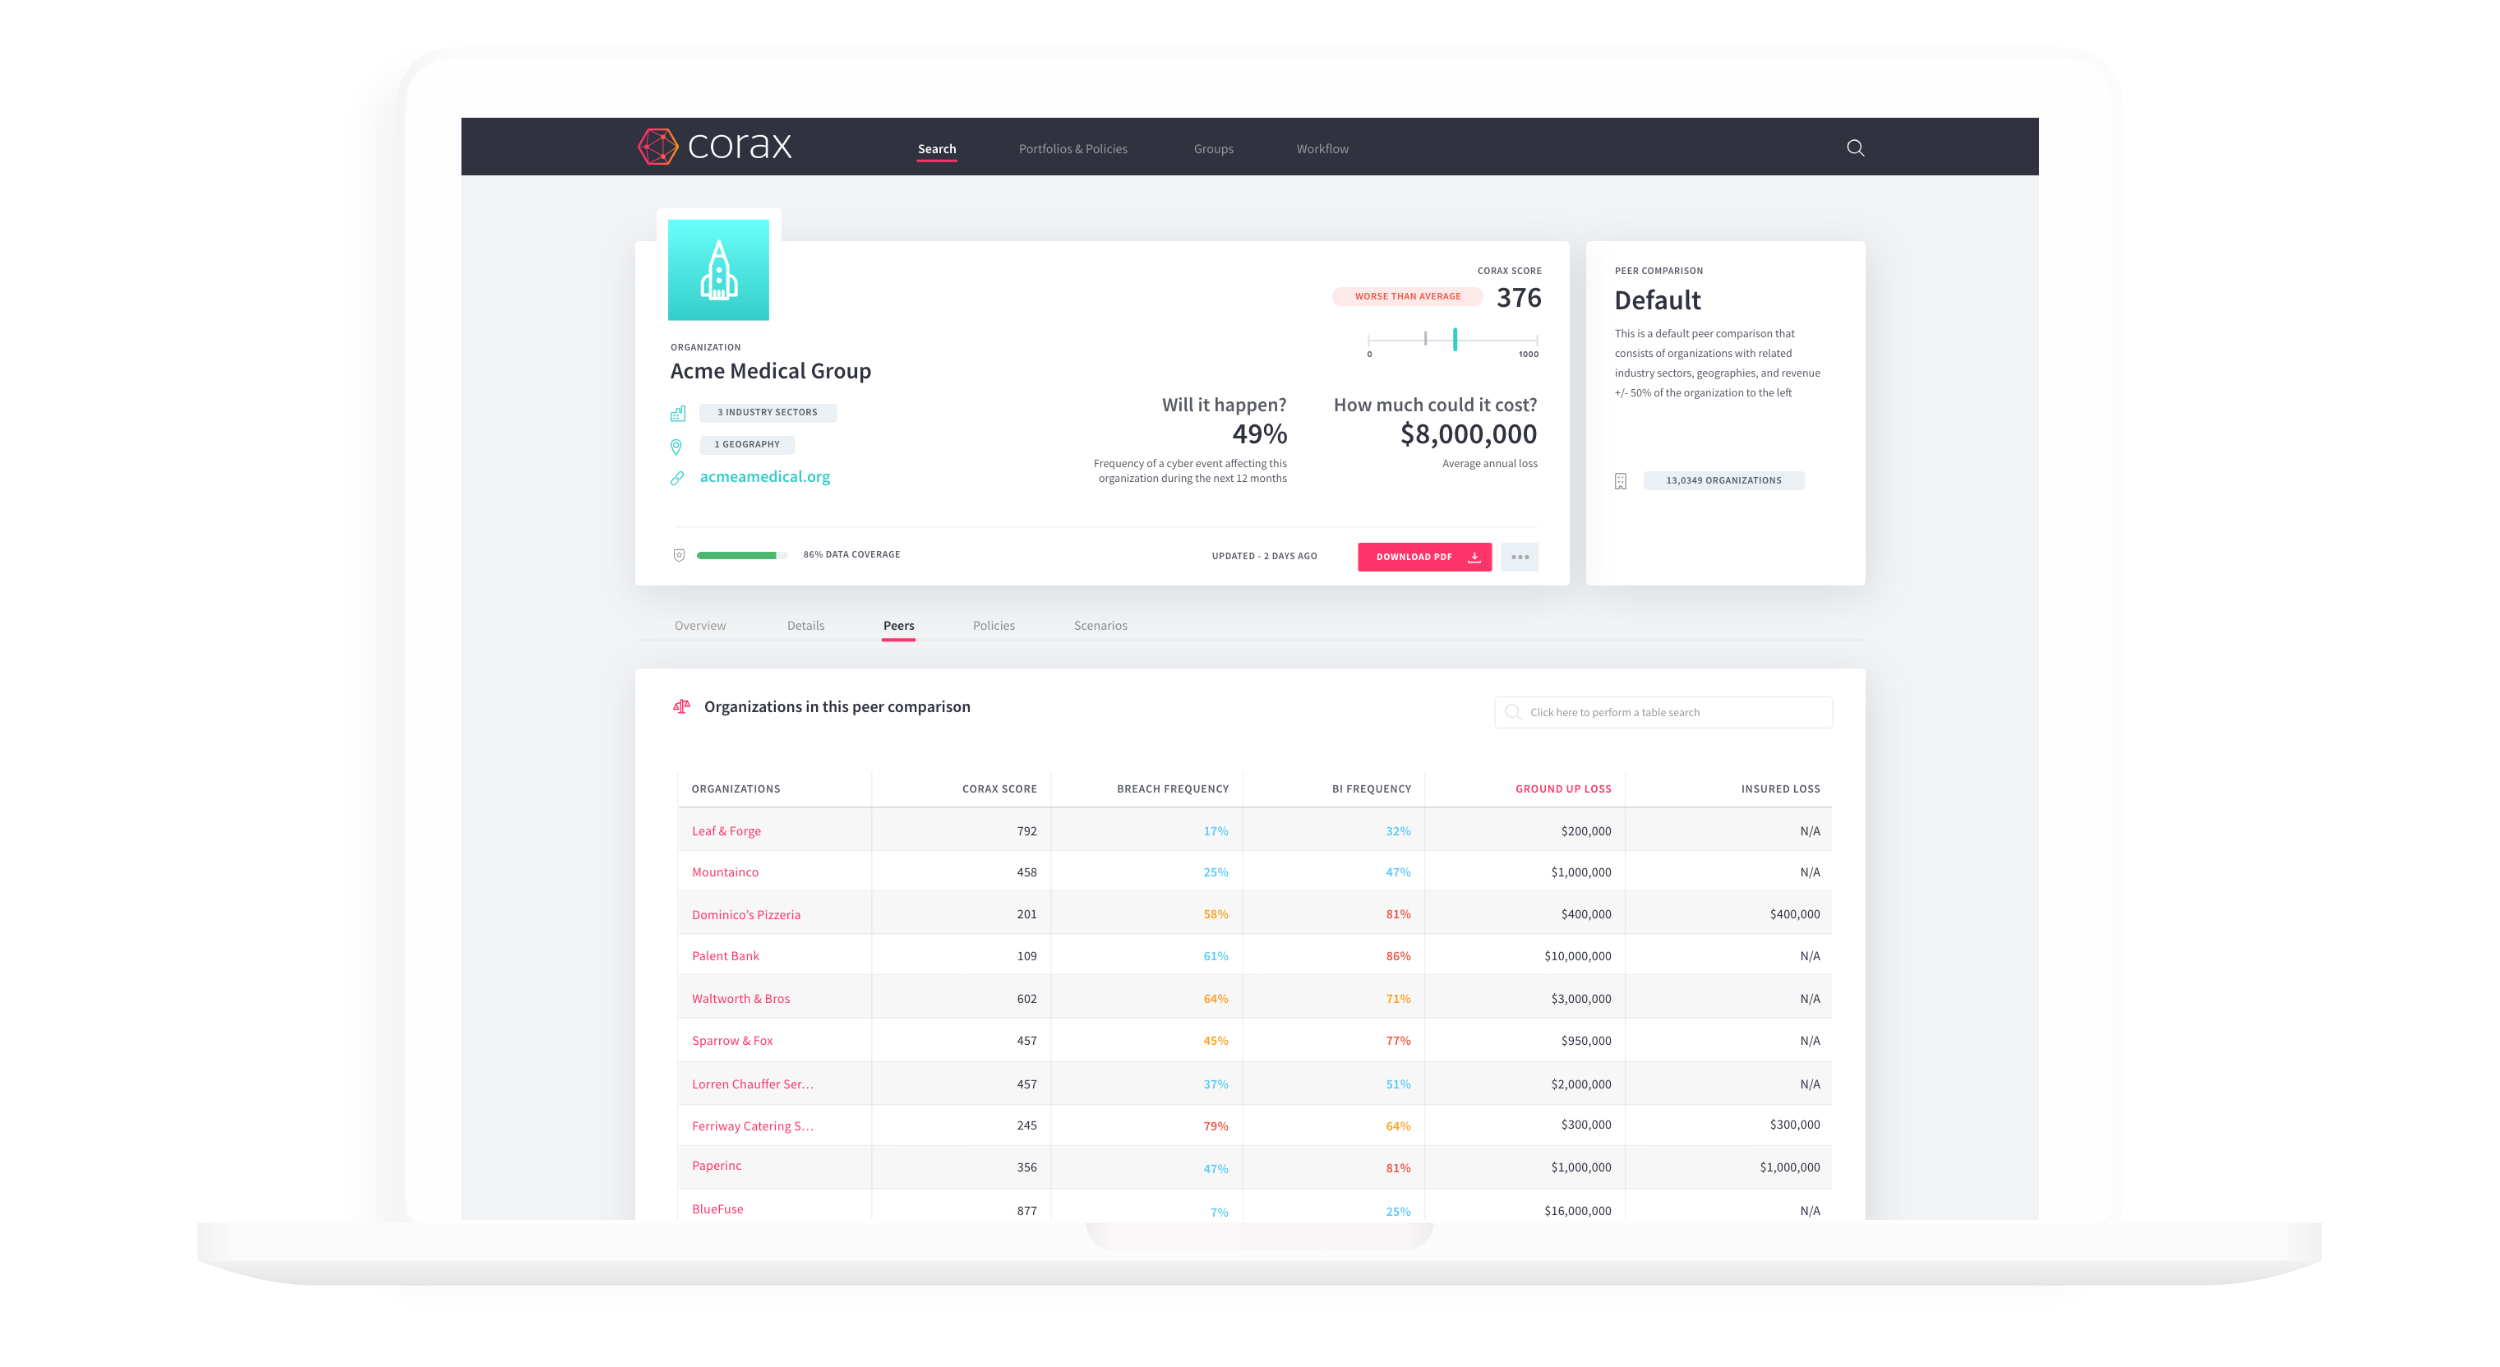
Reports on individual companies include assessment and benchmarking of cyber hygiene and technology resilience; and predict expected costs of data theft and IT disruption. The same outputs are available across portfolios and groups of companies. Scenarios can be run for cyber events, security vulnerabilities, technologies and third parties.
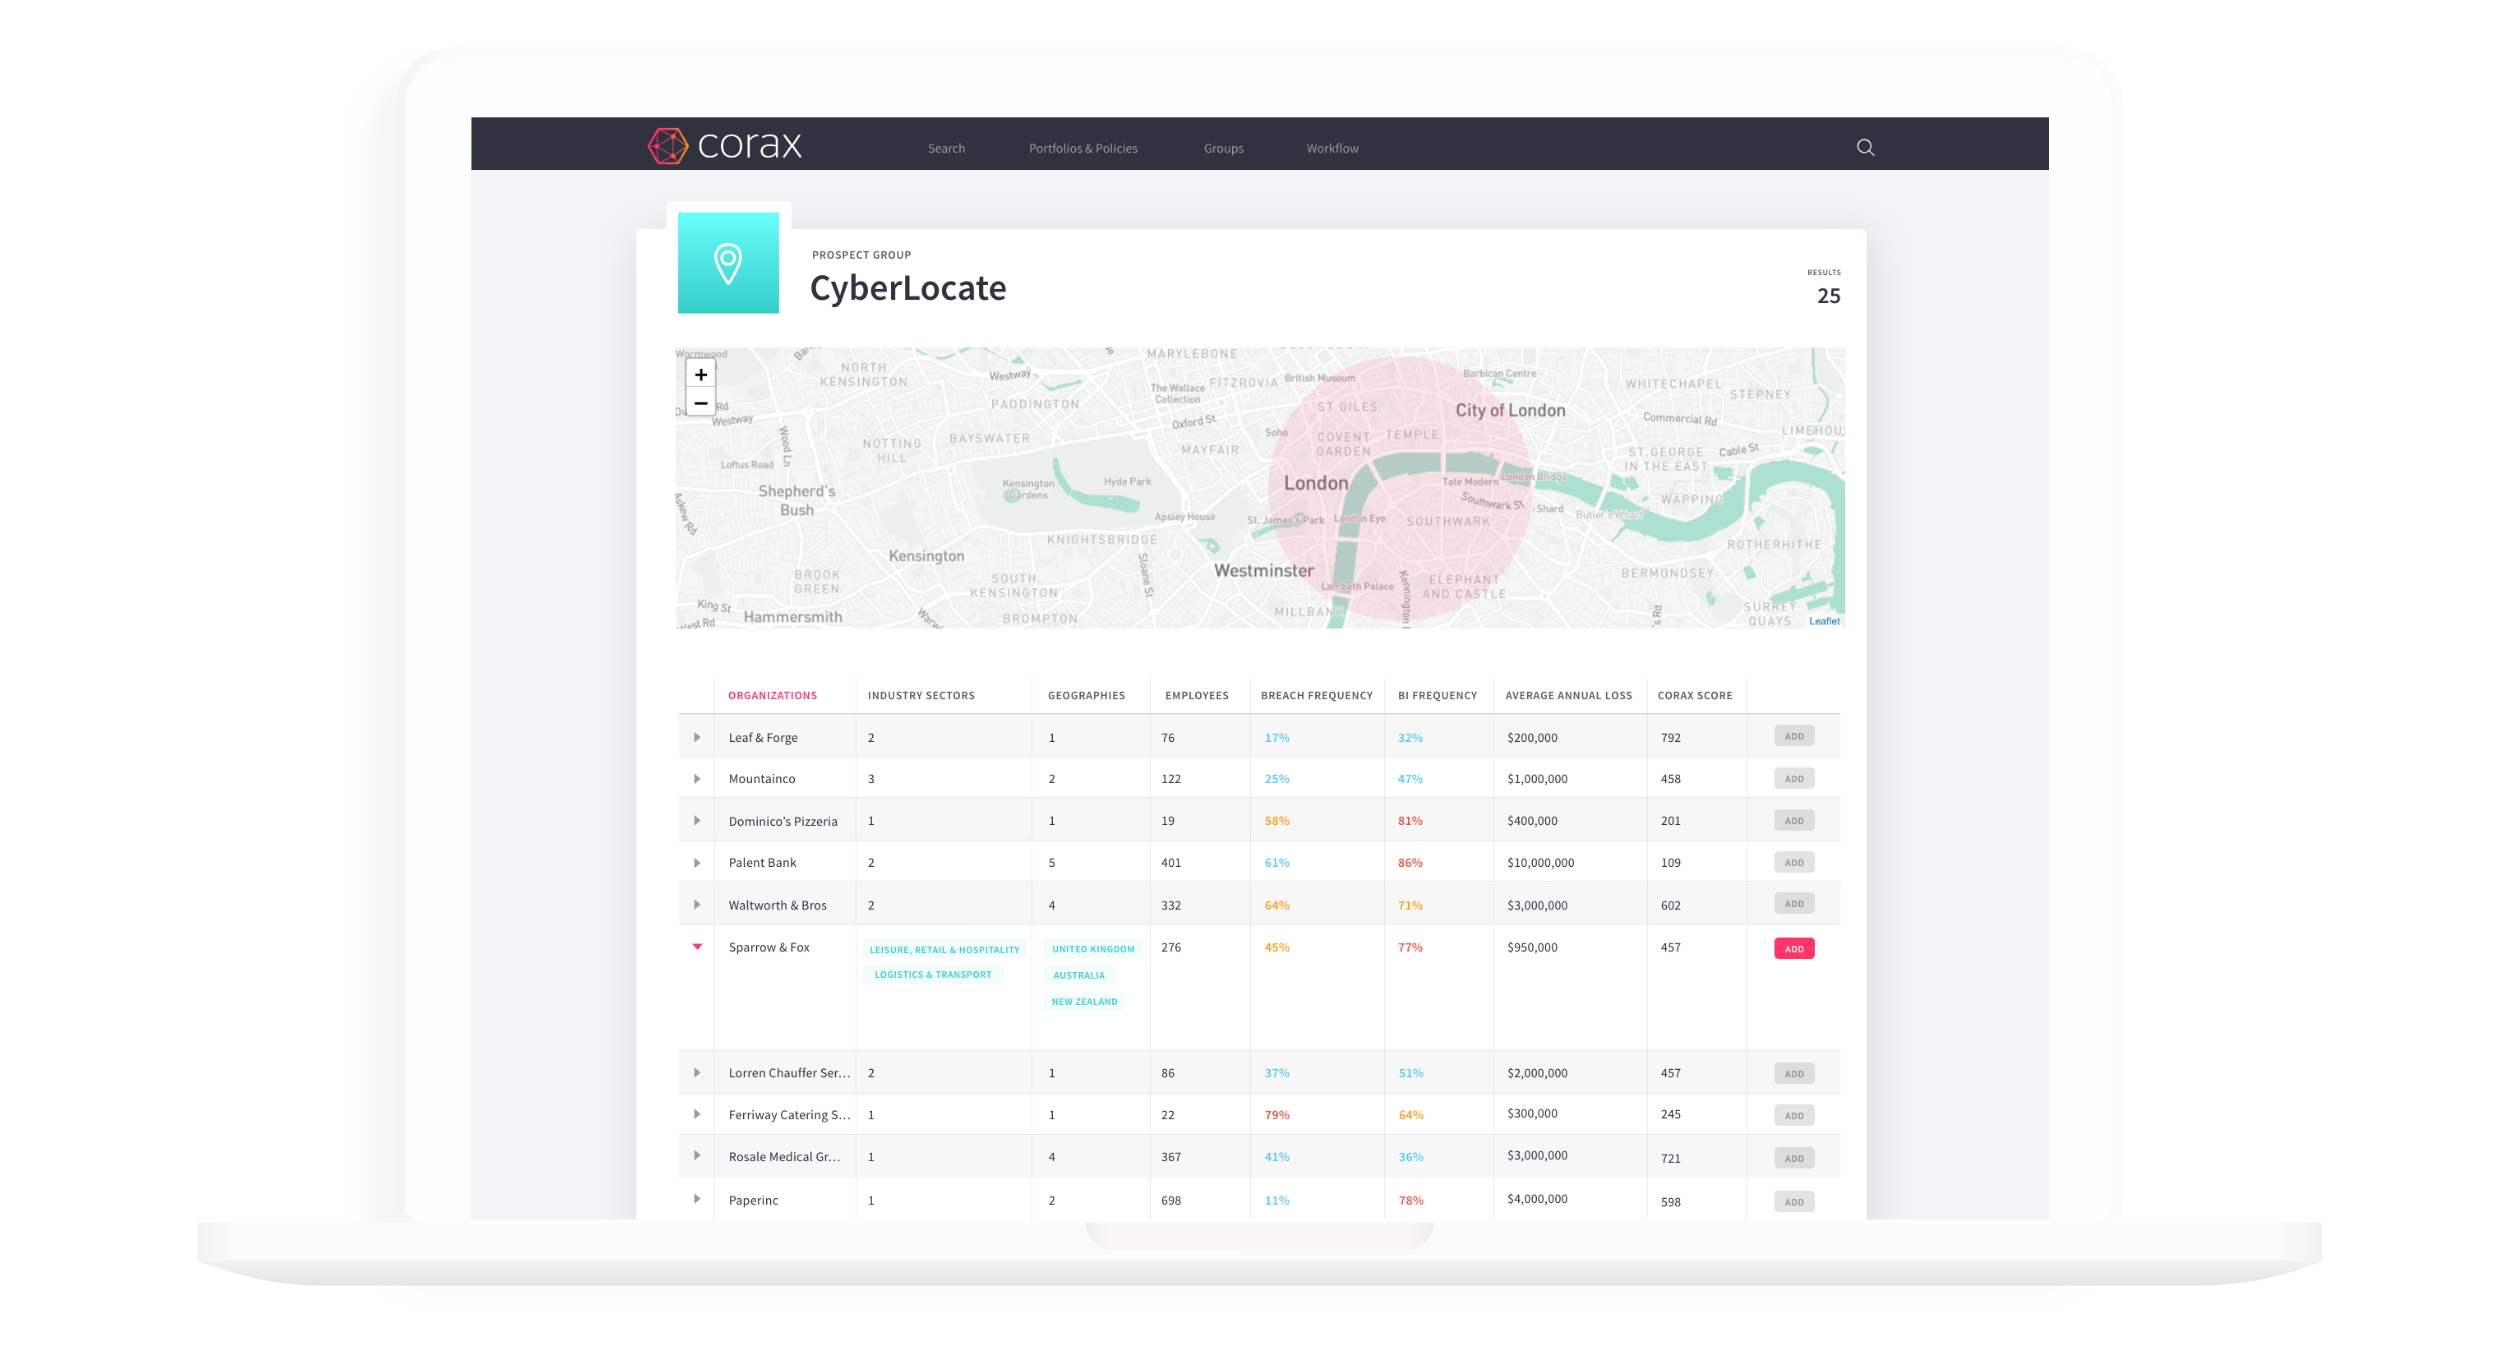
Cross-sell cyber to your existing clients via bulk upload of lists of clients or via API integration of your existing systems. Identify new potential clients using Corax’s cutting edge CyberLocate tool to set geographic search areas.
Strengthen negotiations with carriers. Understand and explain the main drivers of risk. Gain the power to justify premium, limit and retentions based on real data. Calculate the likely premium required to meet a specific profit margin and determine the adequacy of your rate-on-line.
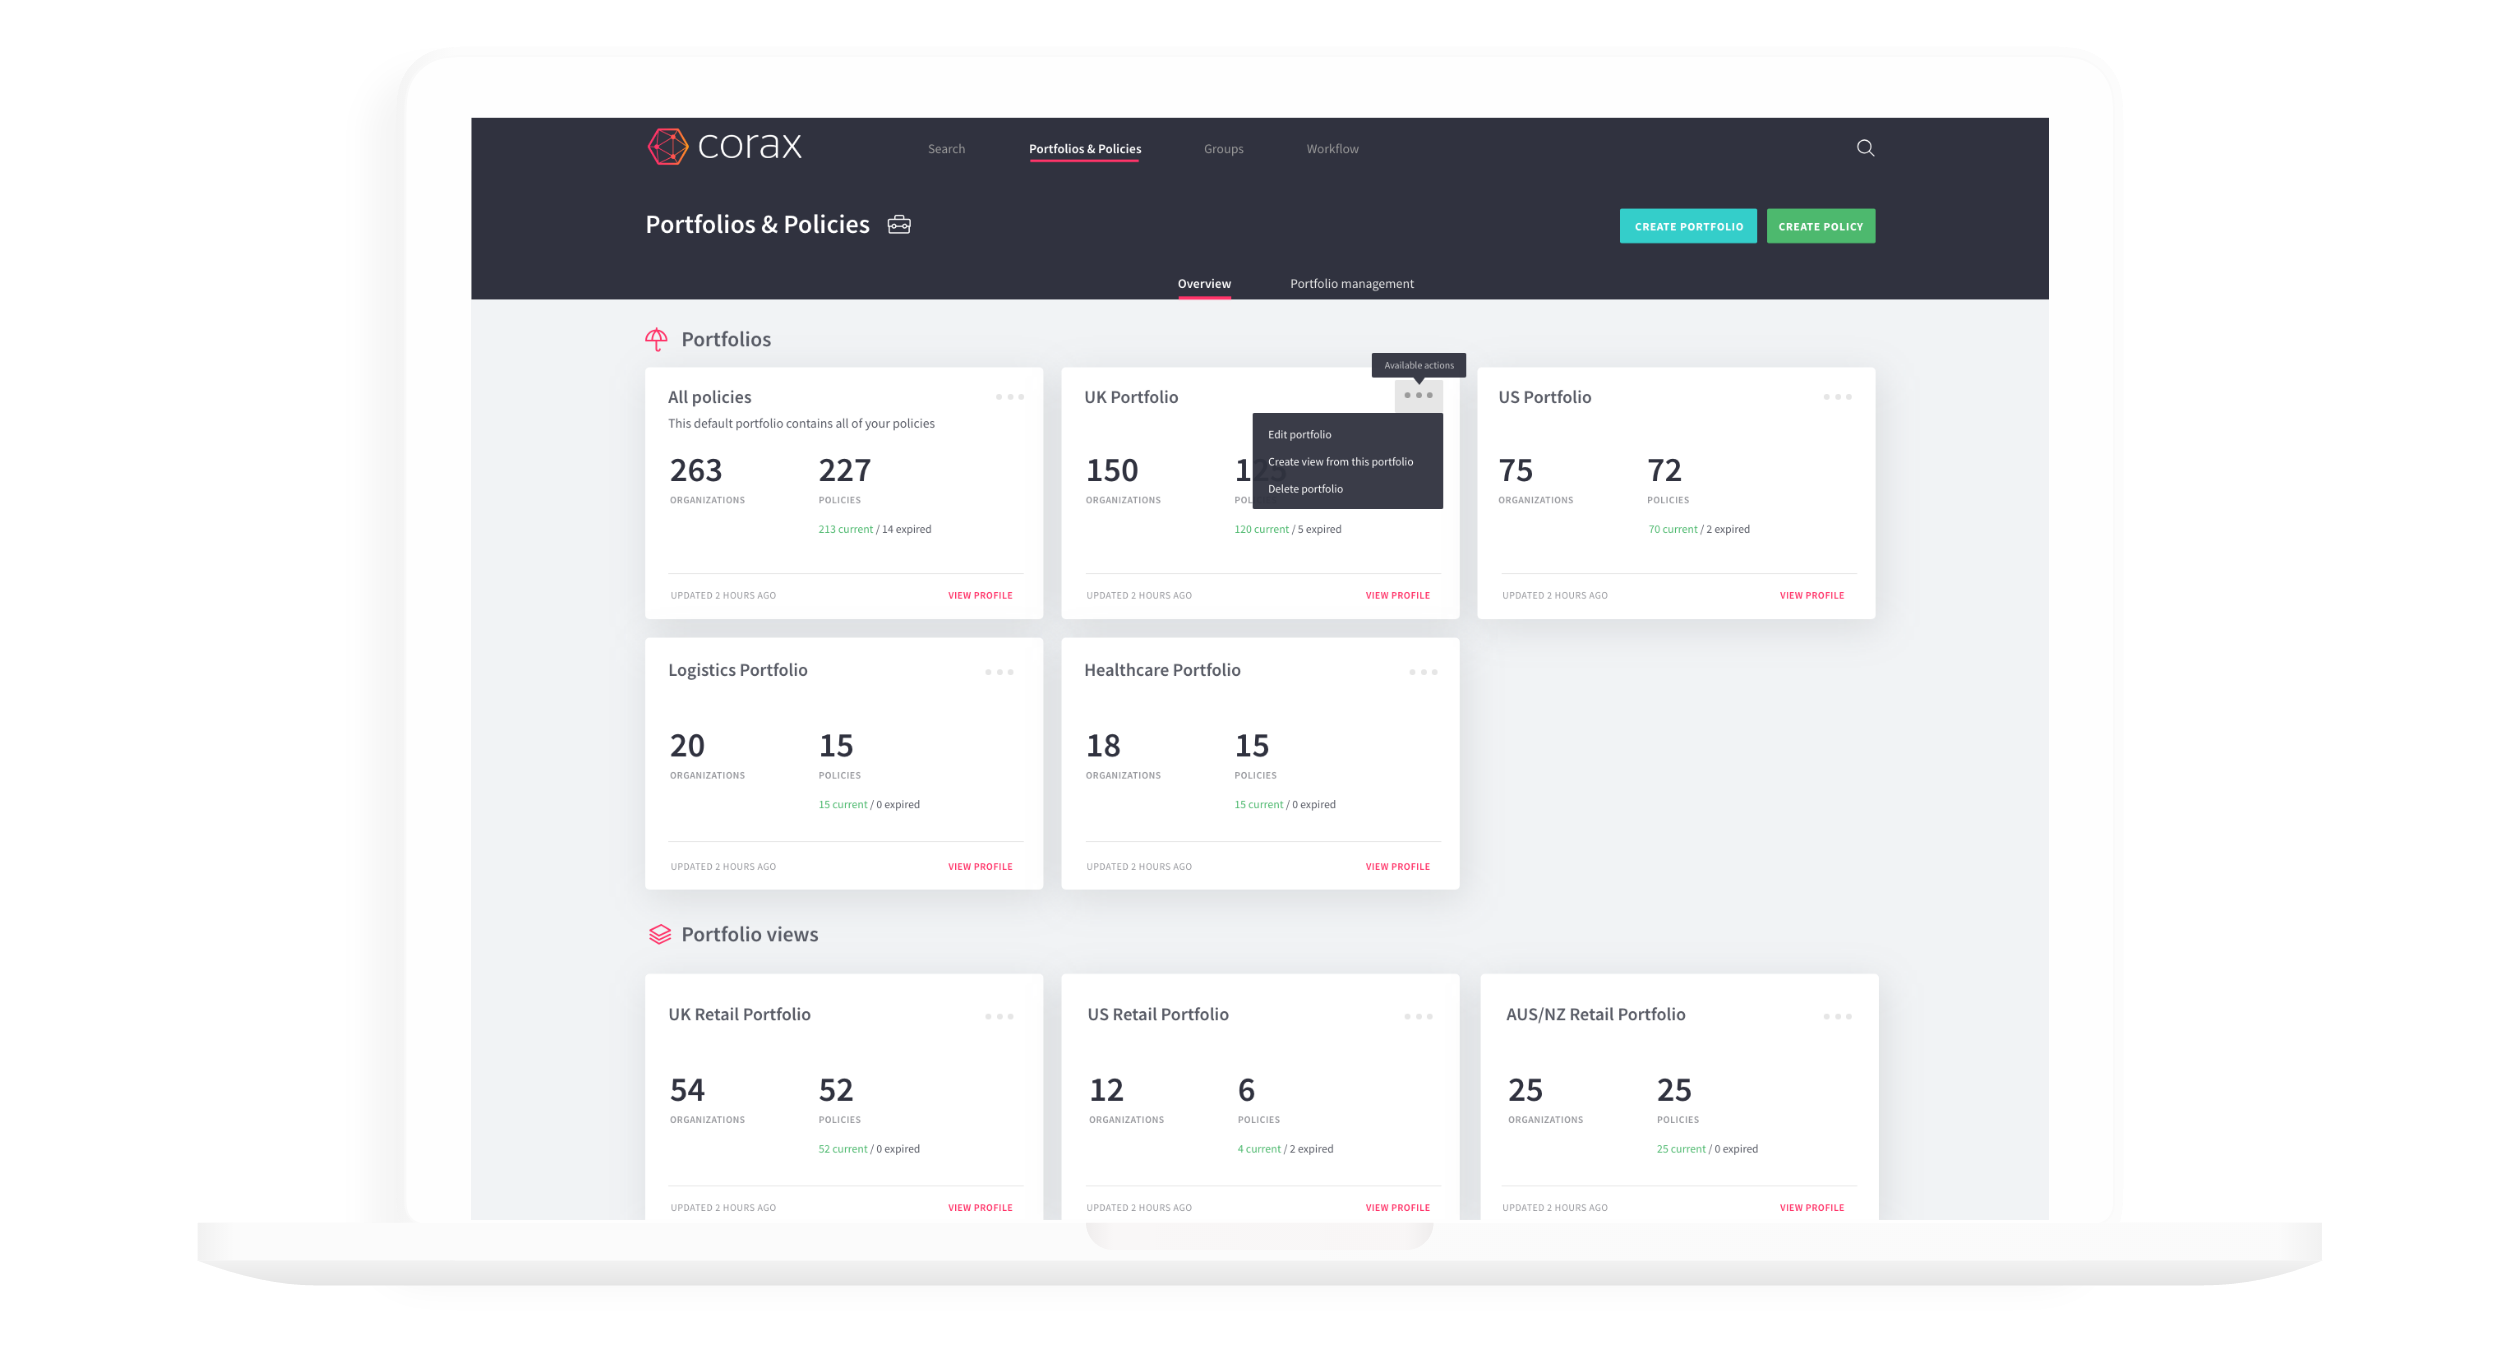
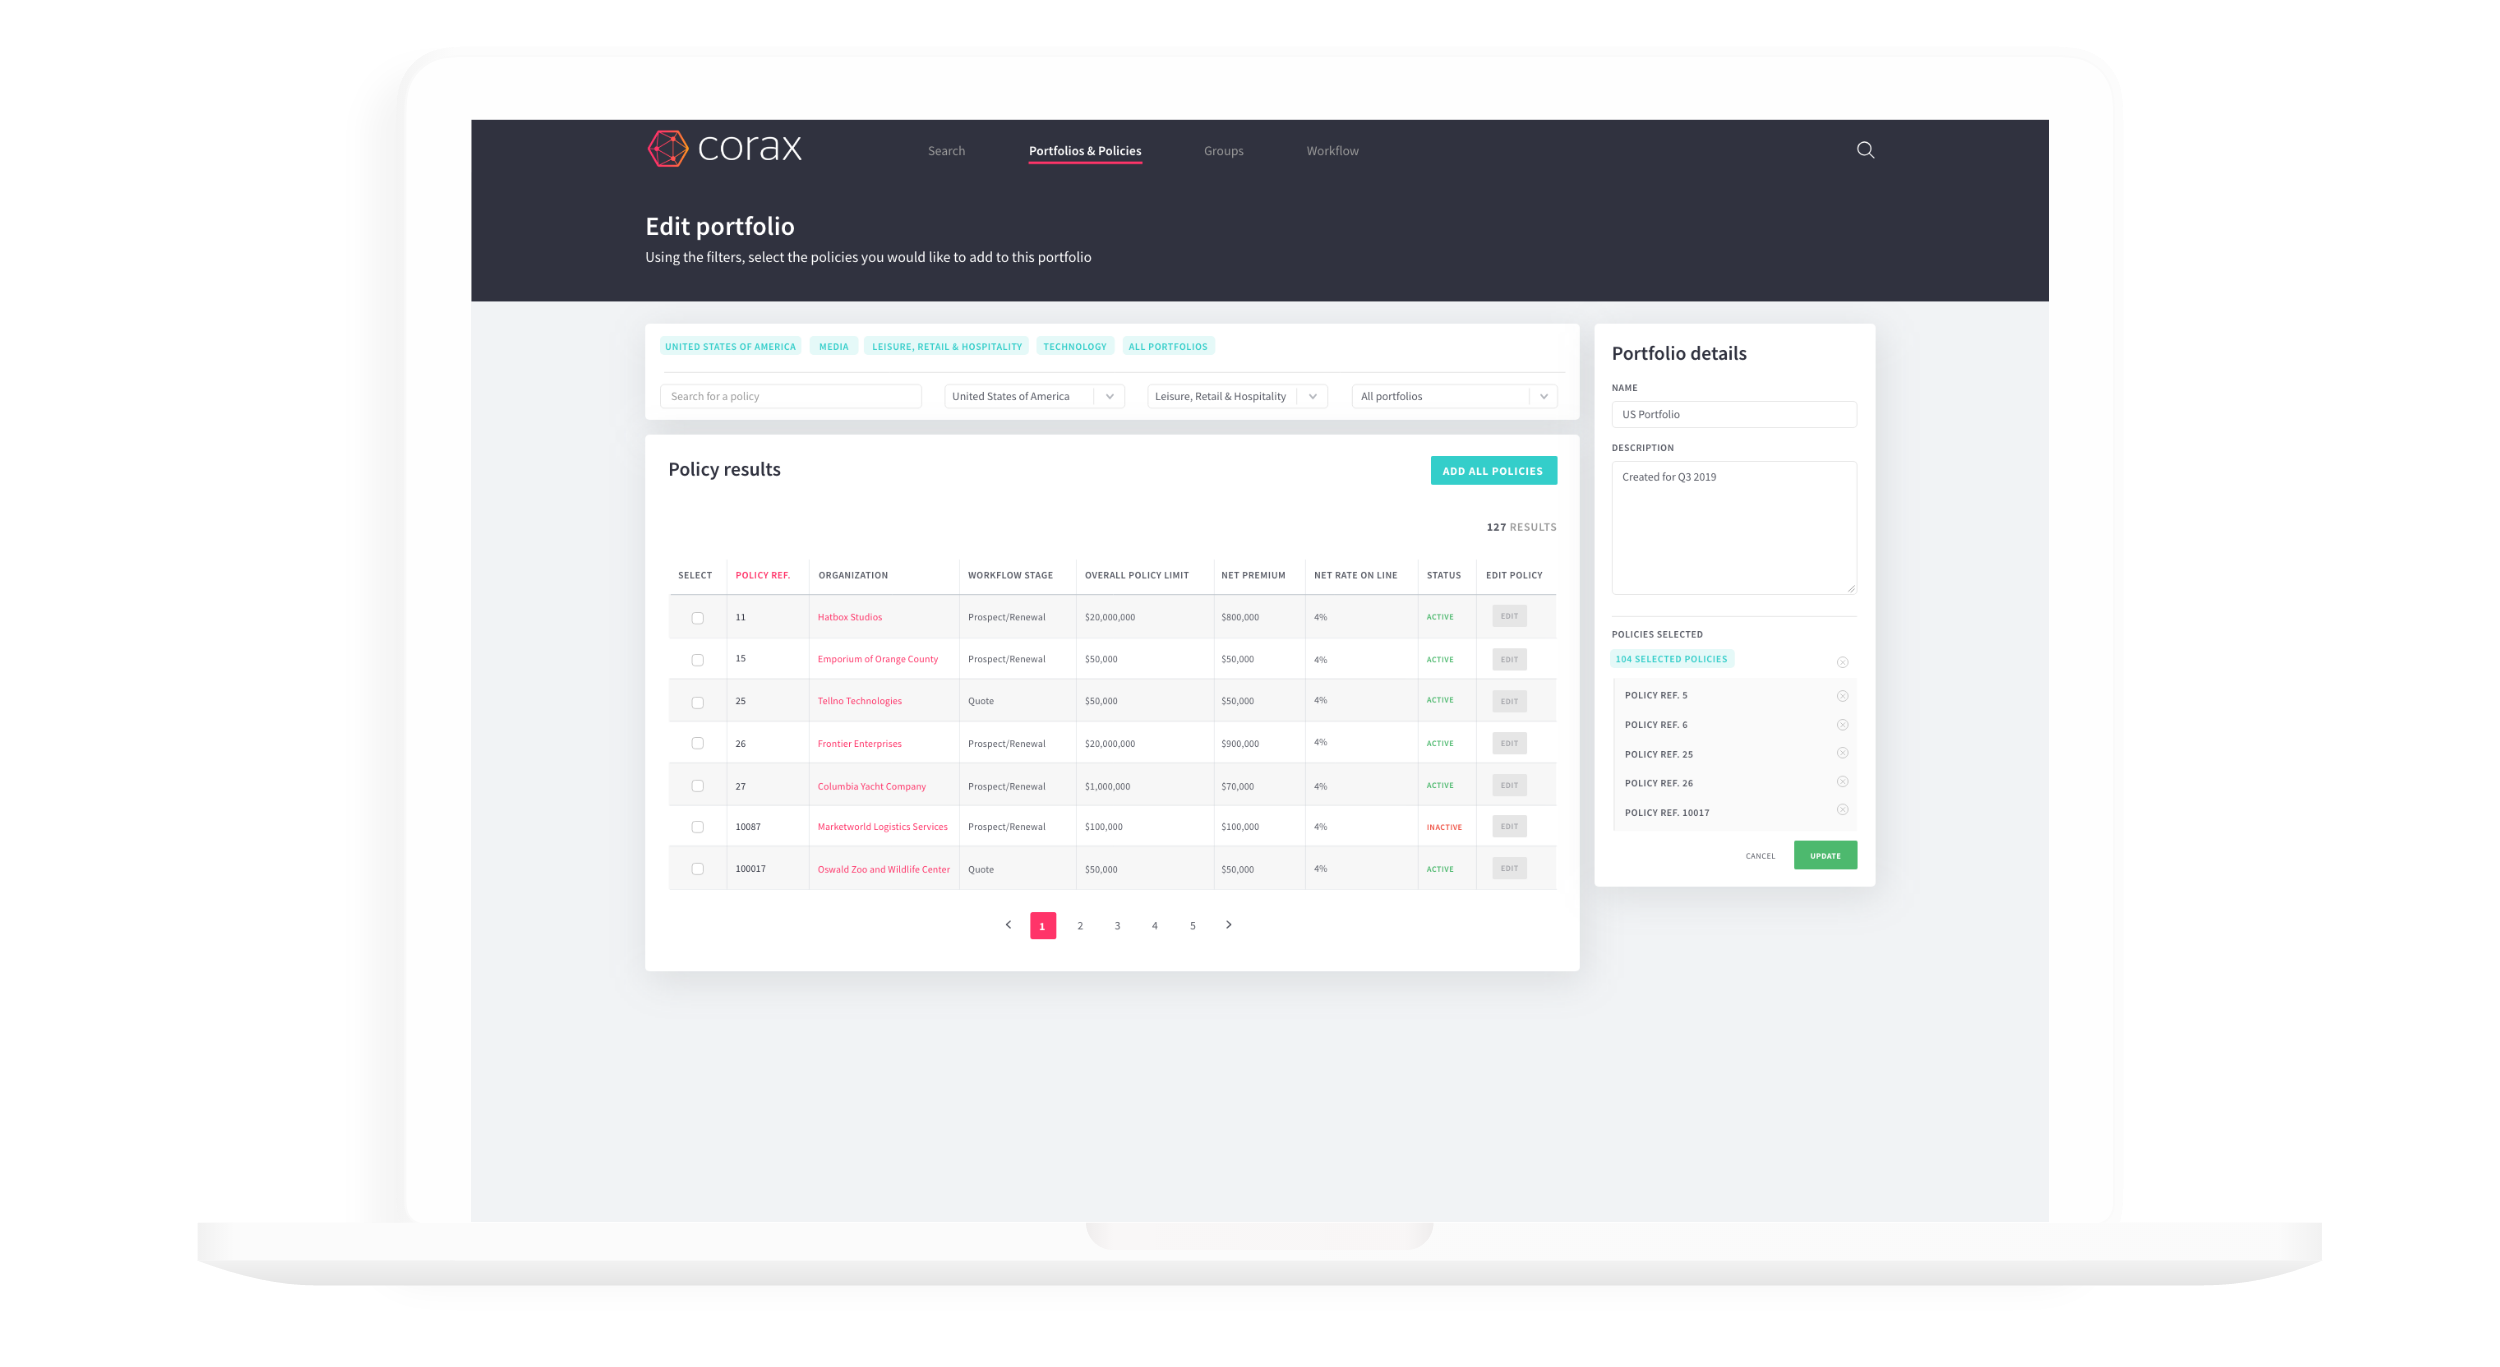
Analyze your overall cyber portfolio, understand the make-up of your clients, identify new business opportunities, and identify trends in risk mitigation requirements.
Corax for Underwriters
The Corax platform provides underwriters with access to insight and reports on the cyber posture of millions of risks. Corax is the only cyber insurance platform on the market giving underwriters the ability to adjust inputs into the Corax model, providing users with their own unique view of that risk alongside the standard Corax model.
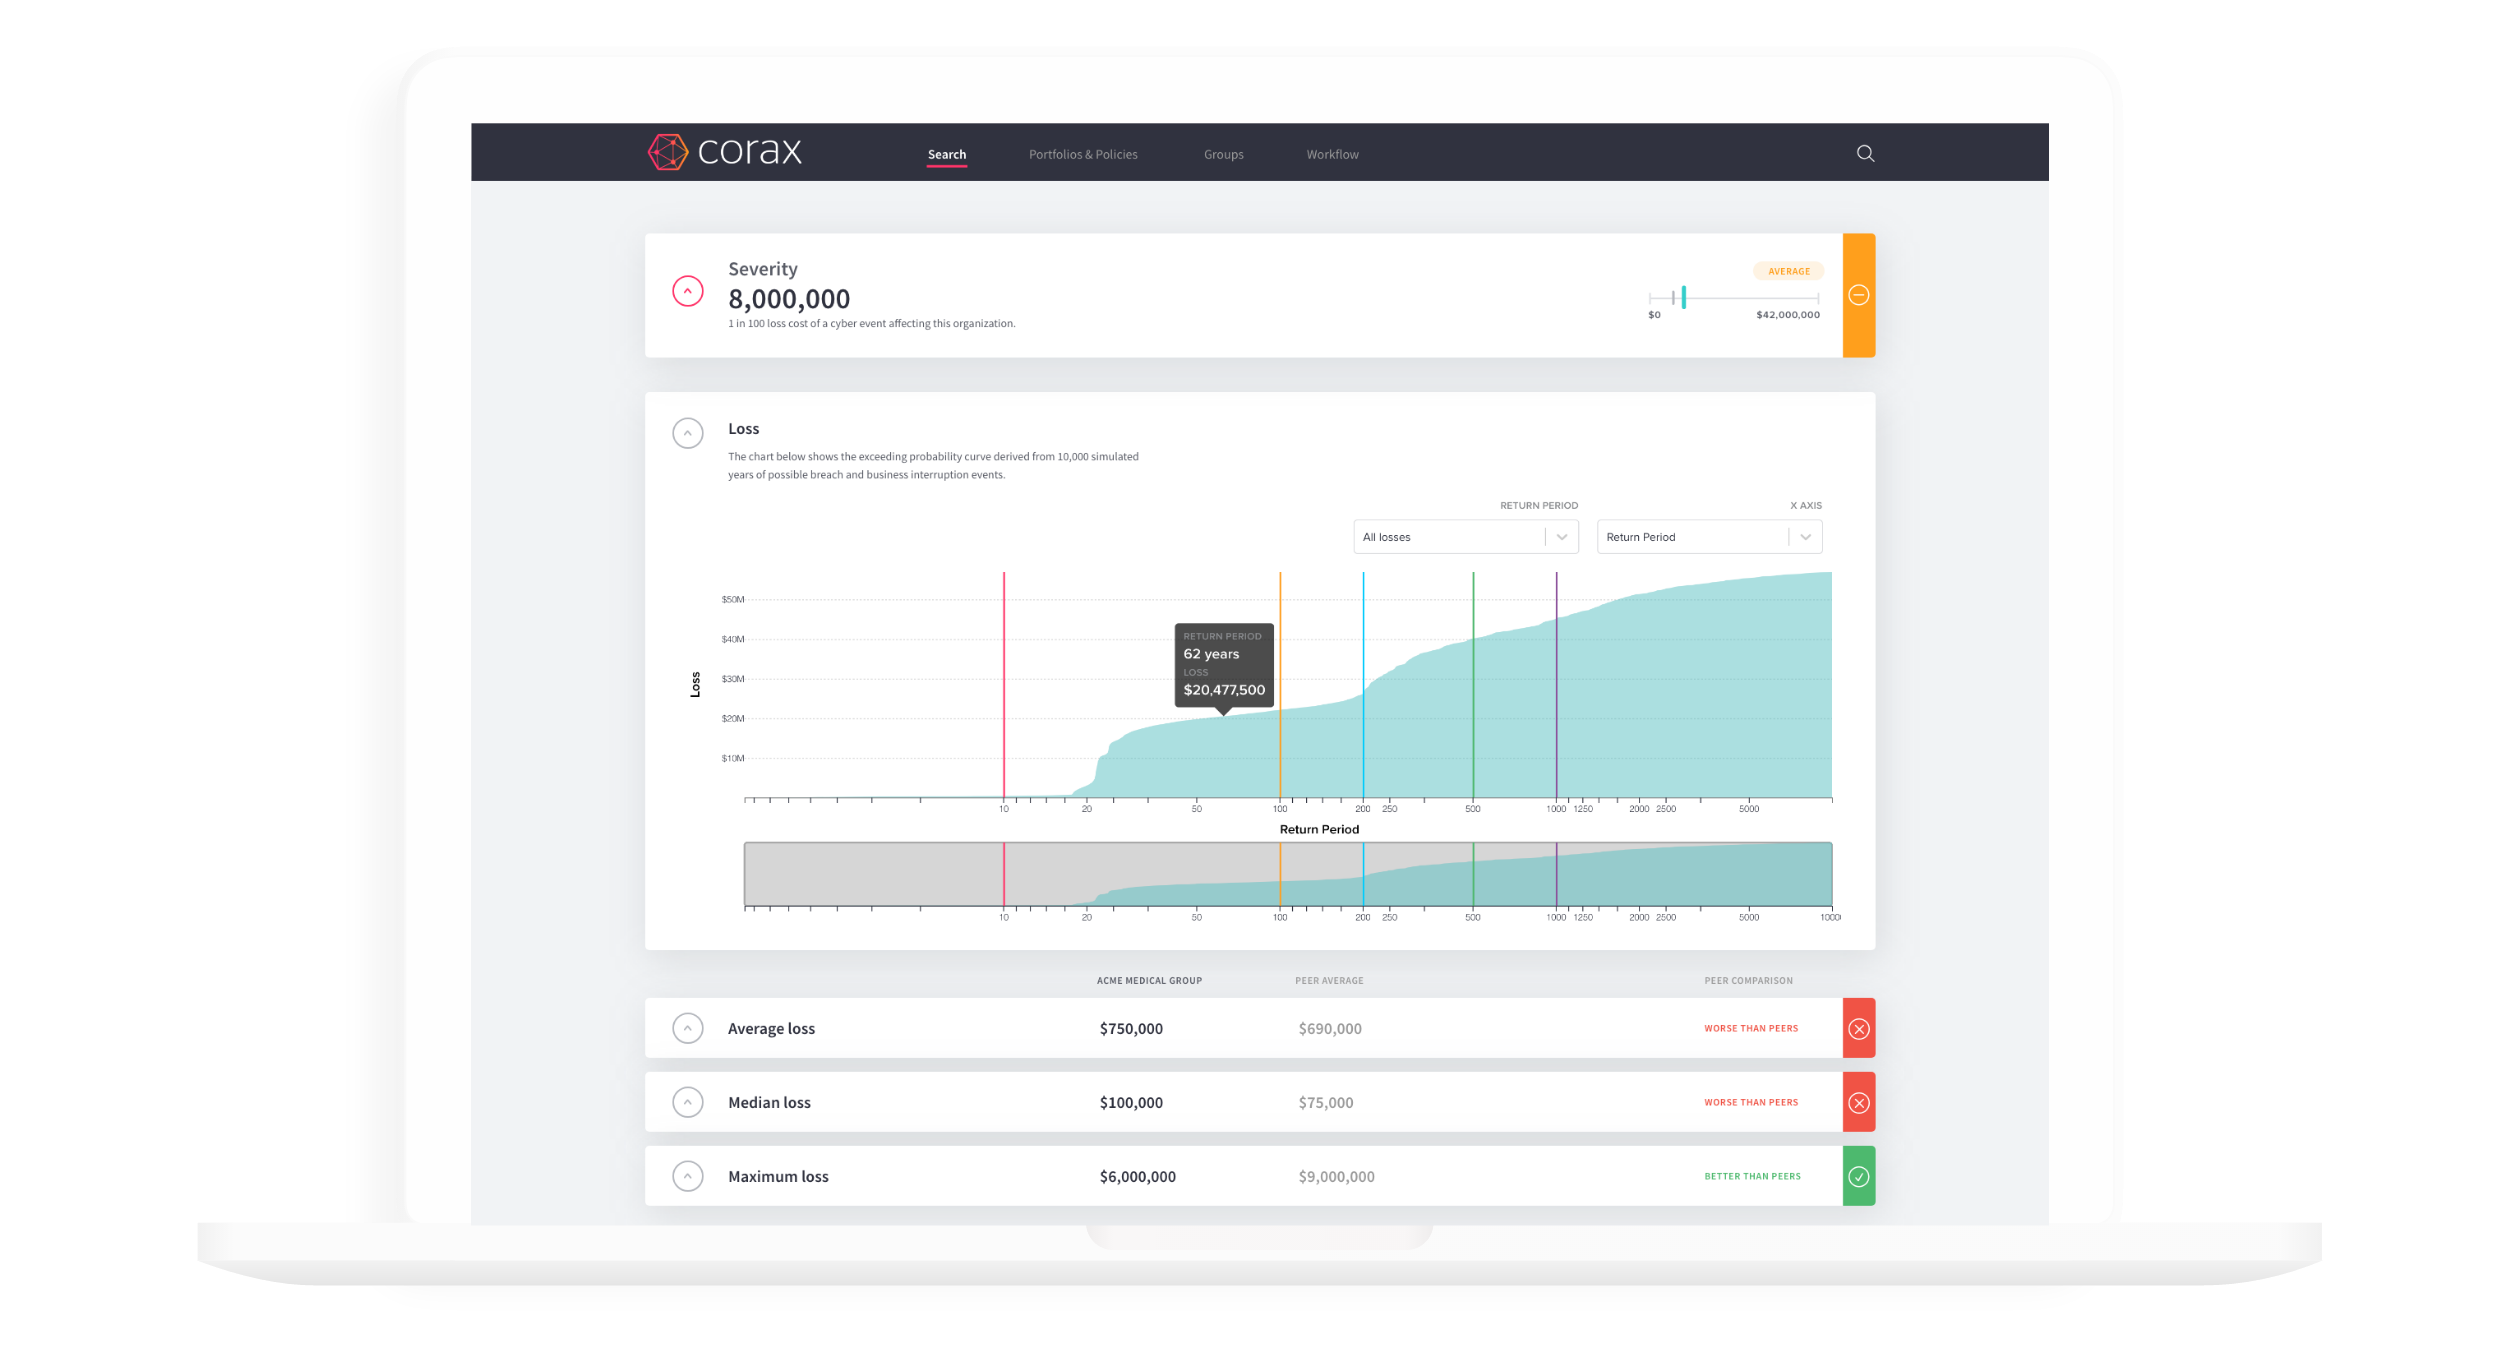
With individual risk ultimately changing inputs at the portfolio level, Corax produces individual Exceedance Probability loss curves intrinsically tied to entire portfolios. EP curves are created through the generation of individual events which can be viewed separately, as well as user-created events.
Make informed decisions. Use advanced risk analytics to create the right cyber insurance packages, at the right premiums. Calculate the likely premium required to meet a specific profit margin. Corax explains the underlying risk associated with the policy, and how to mitigate this with different deductibles, limits and attachment points.
Manage portfolio risk based on real data – see the marginal impact of a new risk to your portfolio, segment your portfolio by risk types, and analyze upcoming renewals within the context of your overall book of business.
Cross-sell cyber to your existing clients via bulk upload of lists of clients or via API integration of your existing systems. Identify new potential clients using Corax’s cutting edge CyberLocate tool to set geographic search areas.


Corax for Exposure Managers
Exposure management teams are using Corax to gain a more accurate view of cyber exposure within their cyber and non-cyber insurance portfolios. The Corax cyber exposure platform delivers a probabilistic view of risk by building profiles of individual risks using proprietary models. Corax is the only cyber insurance platform on the market that gives users the ability to adjust inputs into the Corax model, giving users their own unique view of that risk alongside the standard Corax model.
With individual risk ultimately changing inputs at the portfolio level, Corax produces individual Exceedance Probability loss curves intrinsically tied to entire portfolios. EP curves are created through the generation of individual events which can be viewed separately, as well are user-created events such as the Lloyd’s RDS. This approach gives exposure managers a multitude of individual risk and aggregation techniques, delivering a consistent end to end view of risk across their business.
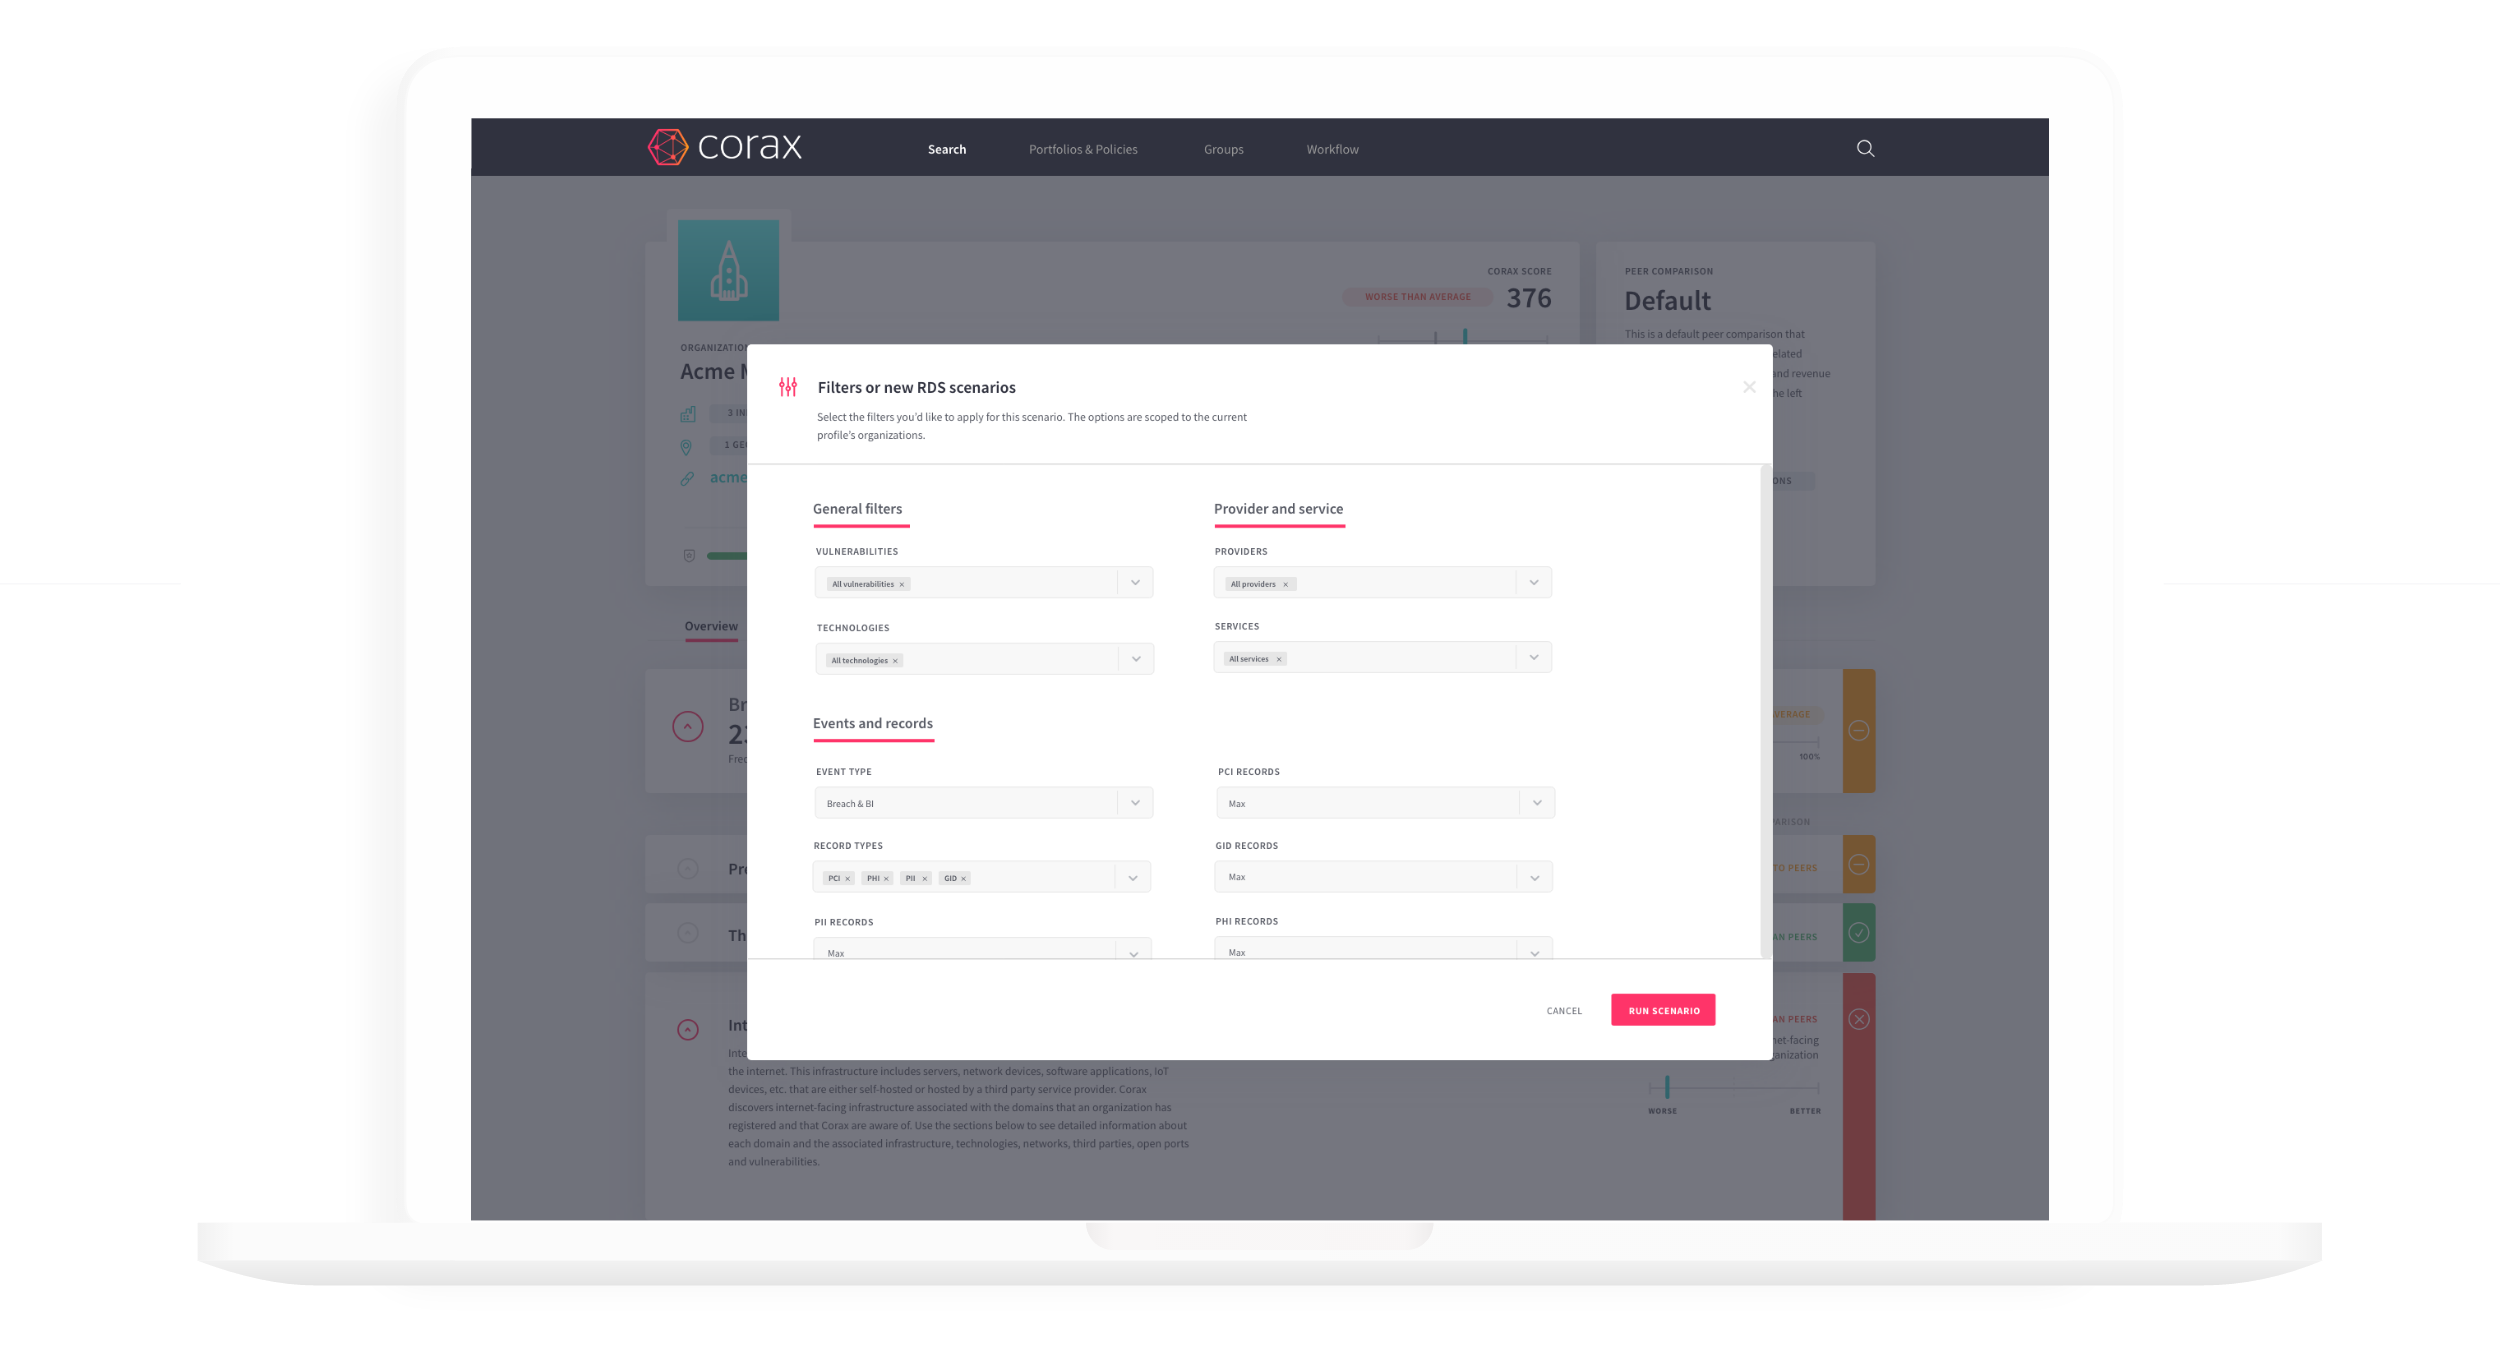
Introduce and model new risks into your portfolio to view overall aggregation and uncover points of aggregation within your portfolio by industry, vendor, geography, or sub-limits in order to quantify, for example, the effect of a 1 in 10 event. Quickly run custom RDS scenarios as well as pre-loaded scenarios, such as prescribed Lloyds scenarios.
Corax’s model produces a YELT output, enabling users to see all scenarios that make up the whole EP curve, which includes historical events. These individual events can be monitored as an alternative aggregate approach, which can also be utilized through user-created events.
Corax has modeled and monitored millions of detailed company risk profiles. This industry view of risk can be analyzed top down to enable users to segment risk and understand the correlation of loss on an industry basis.
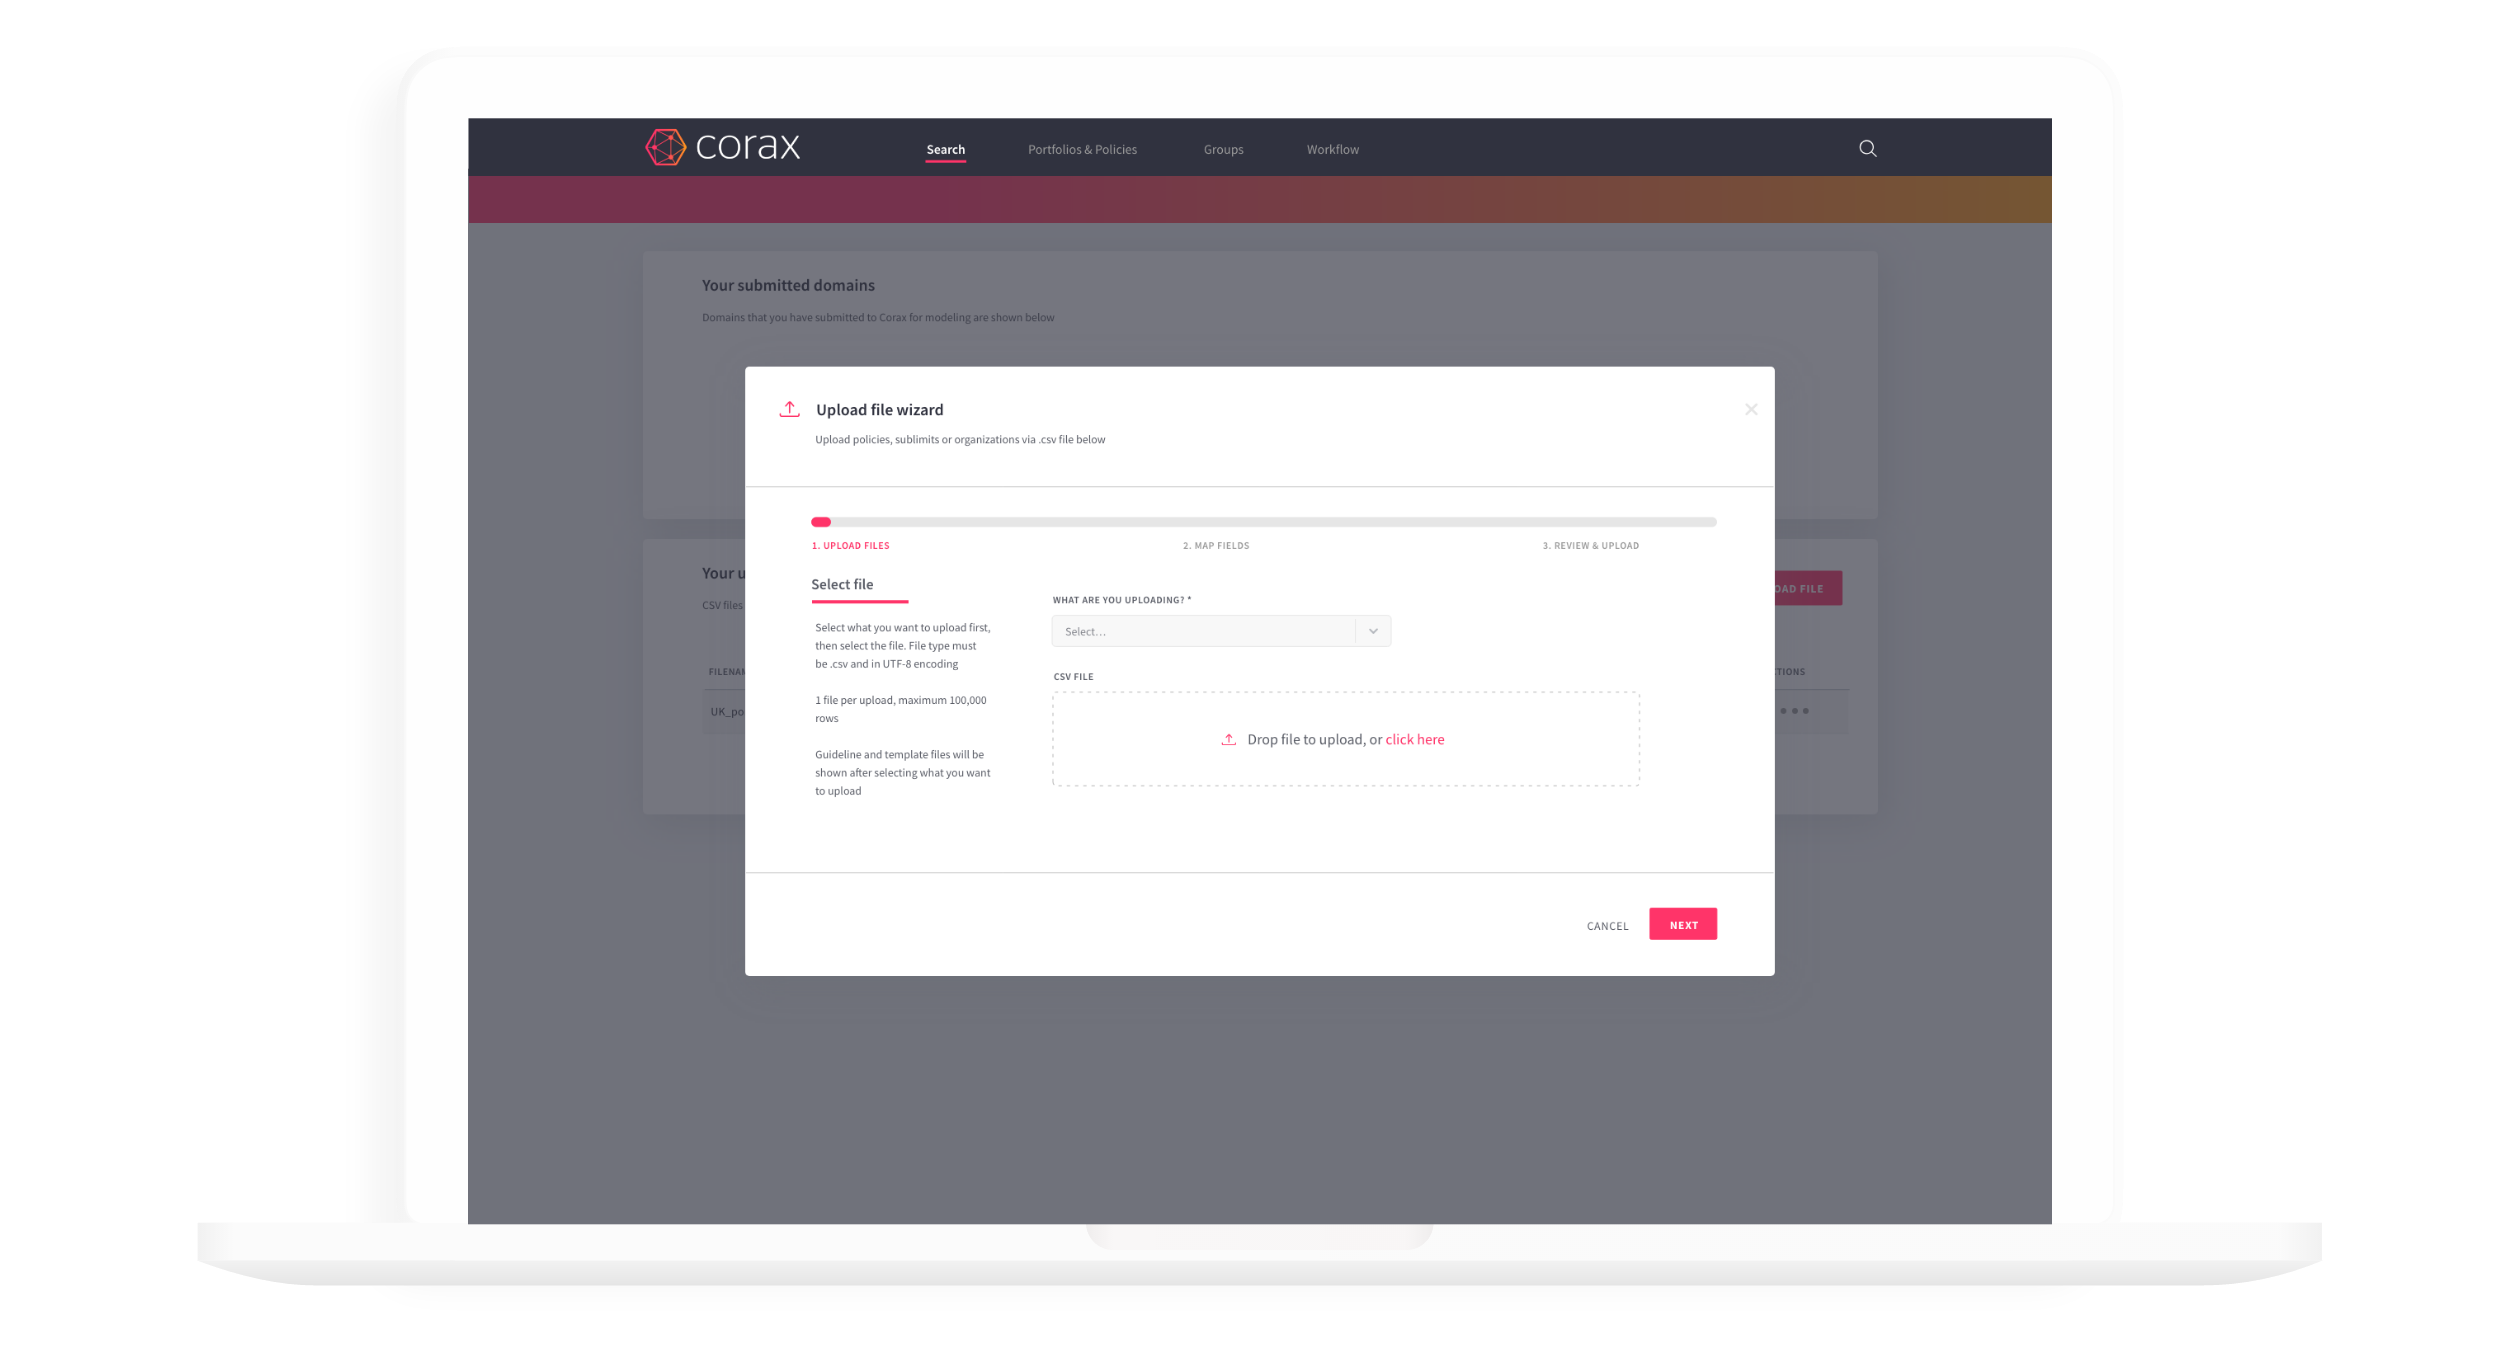
Bulk upload portfolios of policies by csv file, or integrate via API with existing systems for a real time view of risk.


Corax for Reinsurers
Reinsurers are using Corax to gain a more accurate view of exposure by analyzing and aggregating multiple portfolios into a group view of risk.
Users are able to create a view of risk within the Corax model, giving an alternative to the standard model output. In the context of reinsurance, this view of risk can be applied to individual portfolios, whilst still maintaining aggregation abilities across them all. This enables underwriters to analyze clients on a case by case basis in a timely manner, whilst still maintaining the transparency of the impact from individual client views to the overall group impact.
Corax’s financial model is aligned with traditional insurance DFA models, enabling users to input complex structures on an individual or group basis.
Corax has modeled and monitored millions of detailed company risk profiles. This industry view of risk can be analyzed top down to enable users to segment risk and understand the correlation of loss on an industry basis. Users can also utilize this industry view to develop an expected loss from silent cyber profiles.
Corax’s proprietary data discovery and aggregation of third party sources enhances the level of data and insight available at reinsurance level.
Corax’s model produces a YELT output, enabling users to see all scenarios that make up the whole EP curve, which includes historical events. These individual events can be monitored as an alternative aggregate approach, which can also be utilized through user-created events.



Get started with Corax
Explore our pricing options and find out which plan works best for your business.